The persistent disparity in the academic achievement of students from different socio-economic, racial and ethnic backgrounds based on the results of various research studies examining the standardized and school level test results of students in the United States has been reported extensively. As we welcome the year 2020, it is important to reflect on the state of education in our community and beyond. Priority this year and this decade should be focused on ensuring that all our children are provided the necessary competences to lead successful lives in adulthood which in turn enhances our community. Performance scores, like any data, are meaningless unless the scores are analyzed and used to guide intentional decision-making and actions that lead to improved outcomes.
At the National Level The 2018 Programme for International Student Assessment, (PISA), a test of reading, mathematics and science administered every three years to fifteen-year-old students around the world released on December 3, 2019 by the Organisation for Economic Co-operation and Development (OECD) highlight an increased gap in the mathematics and reading scores between socio-economically disadvantaged students and the not socio-economically disadvantaged students in United States, which is larger than the gap between both sub-groups in the top performing countries.
The scores of the 2019 National Assessment for Educational Progress (NAEP), also known as the Nation’s Report card, released on October 30, 2019 highlight the persistent education inequity in the nation and specifically in California because of the lasting gap between high and low performing students. NAEP has been used to measure and compare students’ academic performance across the nation since 1969 for the purpose of improving the US education system.
At the State Level The 2019 8th grade NAEP scores declined in both reading and mathematics in California. The 4th grade 2019 NAEP scores increased slightly. Both the California 8th and 4th grade 2019 NAEP scores are significantly below the national average scores therefore placing California as one of the states with the lowest scores in reading and math.
The scores of California’s students eligible for the National Student Lunch Program (NSLP) or students from socio-economically disadvantaged families paint a worse picture because both 4th and 8th grade students eligible for the NSLP performed significantly lower than the same grade level students not eligible for NSLP.
The achievement gap between white and black students and white and Latino students remain significantly wide. The State Superintendent of Public Instruction, Tony Thurmond, declared when he released the 2018-19 California Assessment of Student Performance and Progress (CAASPP) results on October 9, 2019 that “Disparities between students of color and their white and Asian peers continue from year to year and demonstrate the importance of our priority initiative of closing the achievement gap. Education equity should mean equity for all students and right now, we are not there. All students should have an equal opportunity to succeed academically and enter the workforce prepared with the needed skills to compete in the industries that drive our state forward.”
At the Local Level Based on the recently released 2018-19 California Assessment of Student Performance and Progress (CAASPP) scores, the school districts in Santa Clarita Valley (SCV) are to be commended because the overall students’ performance average is higher than the Los Angeles County and State overall average student performance levels.
However, a deep dive into these CAASPP scores reveal that education equity for all students is far from being achieved in SCV schools because students from socio-economically disadvantaged families and ethnic minority sub groups are not thriving academically. The scores of the economically disadvantaged students (EDS) are not only significantly lower than the scores of the not economically disadvantaged students, but also significantly lower than the overall students’ scores.
In the Antelope Valley (AV) school districts, both the overall and the EDS performance is lower than Los Angeles County and State overall average student performance levels except for the Westside School District’s EDS English Language Arts/Literacy (ELA) performance of 39.14% which is .17% higher than the State’s EDS ELA performance.
Persistent achievement gaps, described in details below, based on race and socio-economic status due to the systemic and disproportionate exclusion of these groups of students from access to rigorous and high quality instruction are evident.
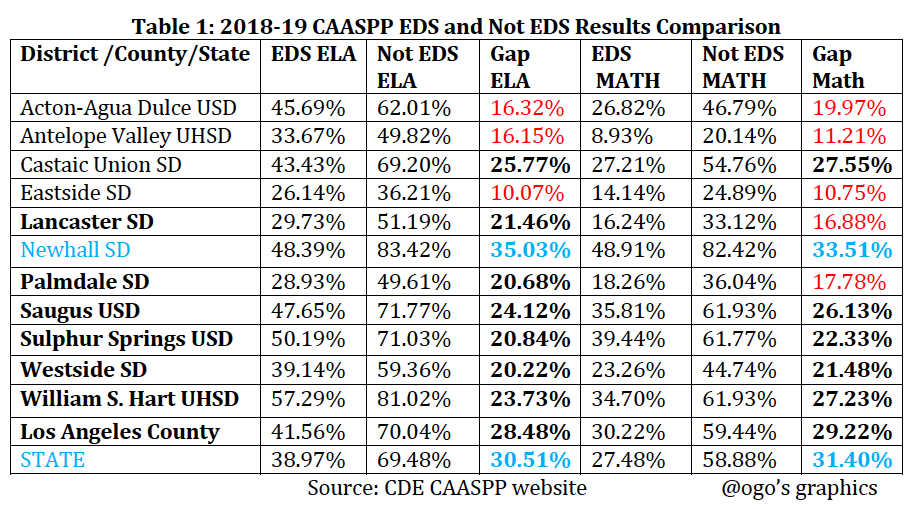
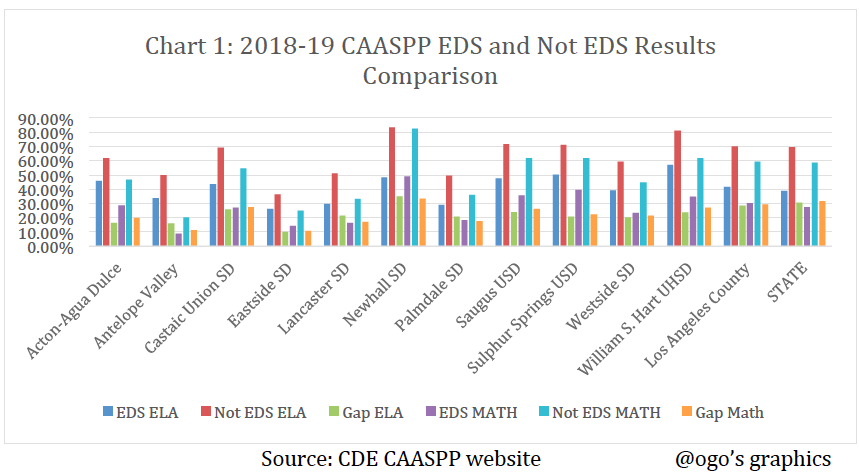
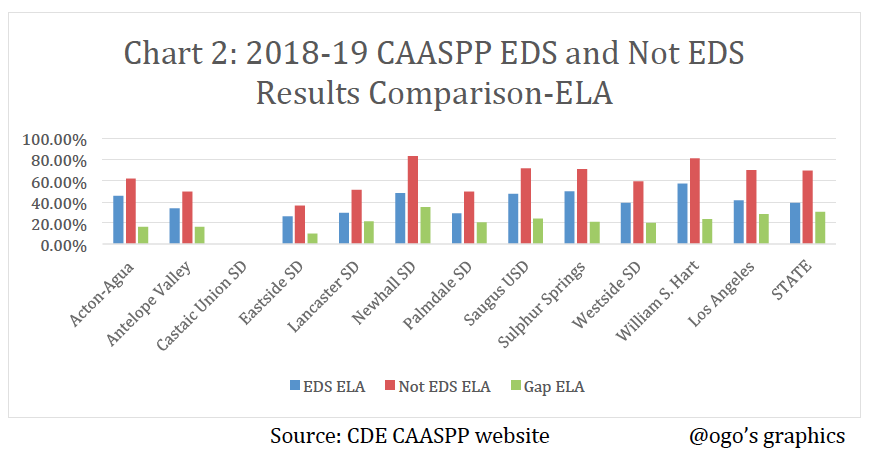
Academic Achievement The 2018-19 ELA/Literacy and Mathematics CAASPP results reported by California Department of Education (CDE) for economically disadvantaged students (EDS) and not economically disadvantaged students who met or exceeded the standards (levels 3 and 4) in the Antelope Valley and Santa Clarita Valley school districts are illustrated in the table and charts below.
The not economically disadvantaged students significantly outperformed the economically disadvantaged students by a 10.07% gap in Eastside School District to a 35.03% gap in Newhall School District.

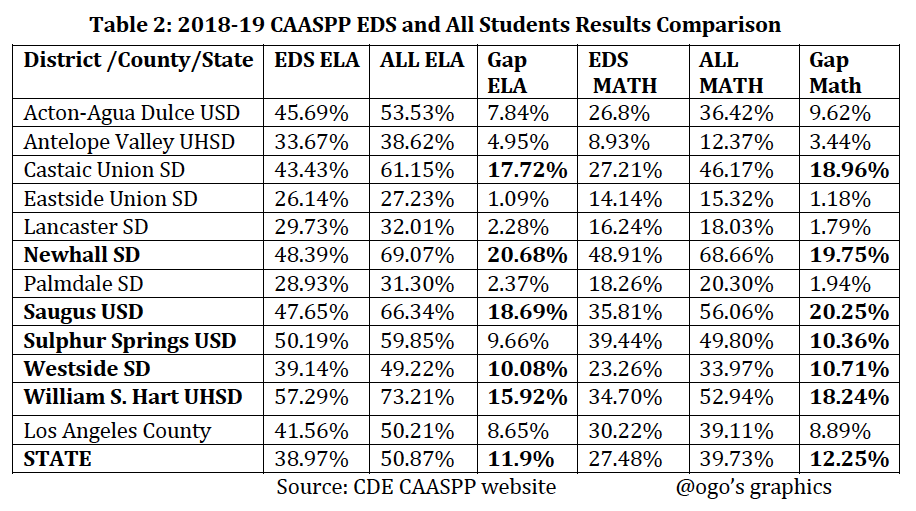
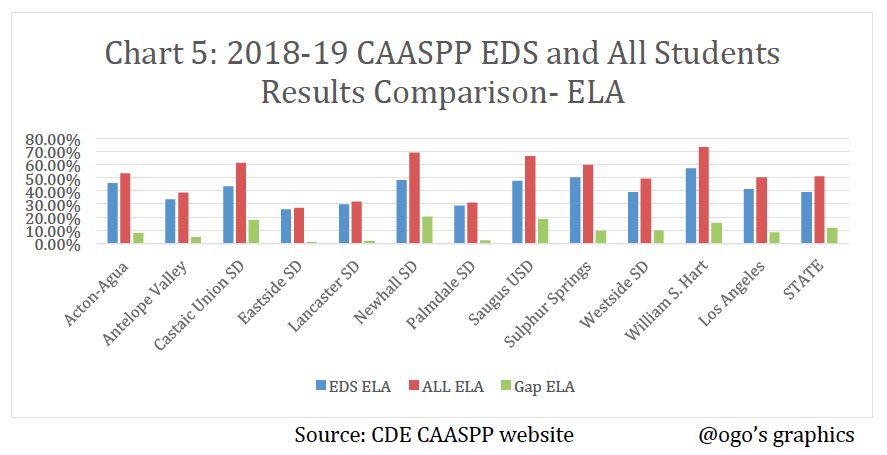
The 2018-19 ELA/Literacy and Mathematics CAASPP results reported by CDE for economically disadvantaged students (EDS) and for all students who met or exceeded the standards (levels 3 and 4) in the Antelope Valley and Santa Clarita Valley school districts are illustrated in the table and charts below.
The economically disadvantaged students’ average scores are significantly lower than the average scores of all students by 1.09% in Eastside School District to 20.68% in Newhall School District. These results demonstrate that about 42-73% in ELA and 51-91% in Math of the economically disadvantaged students in the Santa Clarita and Antelope Valley school districts are performing at below standards.


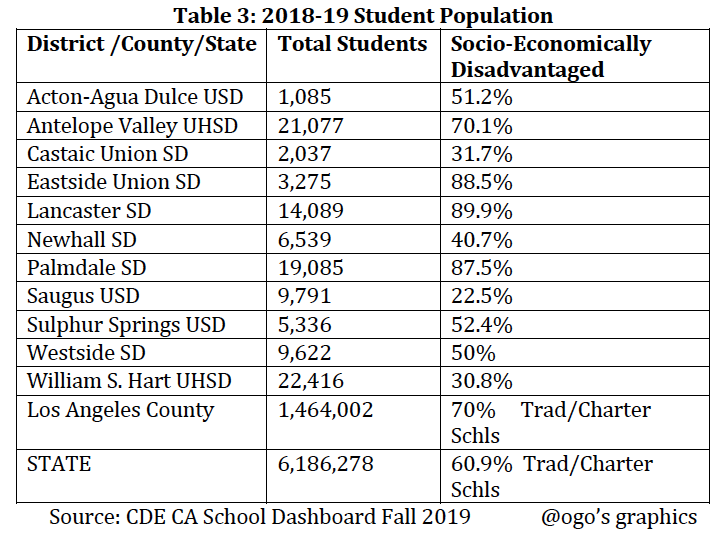
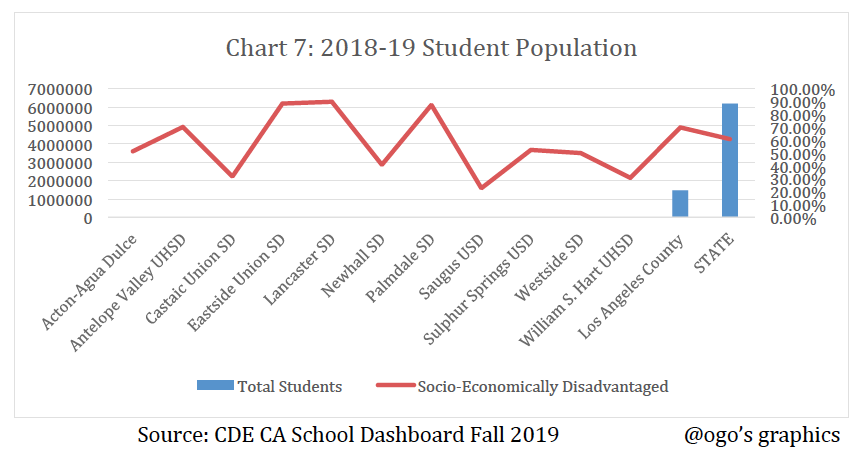
The table and chart below illustrate the percentage of economically disadvantaged students in each of the school districts. This information highlights the relationship between the overall academic performance of the districts and the percentage of EDS. When compared with the previous tables and charts, it is apparent that the higher the percentage of EDS, the lower the overall academic performance. Thus, school districts with lower percentage of EDS have a higher overall average academic performance.
College Readiness According to the four-year adjusted cohort graduation rate (ACGR) data on CDE website reported by Ed-Data, the percent of graduates who completed all the courses required for University of California (UC) and/or California State University (CSU) entrance with a grade of “C” or better in the high school districts in Antelope and Santa Clarita valleys in 2017-18 range from 20.1% in Acton-Agua Dulce (AADUSD), 33.4% in Antelope Valley Union High School District (AVUHSD) to 50.9% in William S. Hart Union High School District (WHUHSD), and a 56.2% average in the Los Angeles County.
However, the percent of socioeconomically disadvantaged (SED) graduates within the same cohort who completed all the courses required for UC and/or CSU entrance with a grade of “C” or better in the high school districts in Antelope and Santa Clarita valleys in 2017-18 is much lower and range from 11.8% in AADUSD, 30.1 in AVUHSD to 37.3% in WHUHSD, and a 52.6% average in the Los Angeles County.
Additionally, the percentage of SED graduates in SCV and AV who completed all the courses required for UC and/or CSU entrance with a grade of “C” or better is remarkably lower than the county average.
These results demonstrate that over 50% average of high school students in the SCV and AV school districts are not completing all the courses required for UC and/or CSU entrance with a grade of “C” or better.
College Enrollment On July 11, 2019, the first ever College-Going Report (CGR) that depicts the college enrollment of California public high school graduates was released. The CGR which is found on the CDE’s DataQuest breaks down college enrollment at the state, county, district, and school levels by student group and postsecondary institutions. The CGR documents that 64.4% of California public high school graduates enrolled in college within 12 months of leaving high school in 2017-18. The demographics of these enrollees are 83.9% Asian, 70.4% white, 59.7% African American, 58.7% Pacific Islander and 57.6% Hispanic/Latino.
The CGR shows that the 2017-18 college enrollment rate in the high school districts in Antelope and Santa Clarita valleys range from 55.8% in AADUSD, 60.8% in AVUHSD to 75.6% in WHUHSD, and a 61.9% average in the Los Angeles County. AADUSD and AVUHSD rates are lower than the Los Angeles County rate while AADUSD, AVUHSD and the Los Angeles County rates are lower than the State college enrollment rate of public high school graduates.
However, socioeconomically disadvantaged students’ college enrollment rate is much lower in the high school districts in Antelope and Santa Clarita valleys and range from 52.2% in AADUSD, 59% in AVUHSD to 65.6% in WHUHSD, and a 56.8% average in the Los Angeles County.
Then What? These statistics categorically show that the economically disadvantaged students will benefit tremendously from an educational program that will address the identified gaps. Further, the data demonstrates the compelling and apparent need for strong intervention and support strategies that will enable these students to perform successfully on the standardized tests while accessing the courses needed to be successful in college. These persistent gaps in achievement based on race and income level are not as a result of a lack of ability, but primarily due to lack of access to appropriate interventions and rigorous college preparatory education. While college attendance is by choice and not mandatory, all students upon high school graduation should be equipped with skills to be successful in college. As Santa Clarita, the 3rd largest city in Los Angeles and all the surrounding cities continue to grow, build new homes and attract a variety of families, it is important that we plan for the impact of this growth in order to make sure that the community we love and call home remains a great place for all families and residents by providing desired education options that will enable all students to be successful.
Traditional public schools are doing their best and yet year after year the economically disadvantaged students continue to perform significantly lower than their economically advantaged peers. It is quite clear, that traditional public schools should not be the only public education option for families. Families who could afford to do so, choose private schools for their children while some other families choose to home school their children. However, families who cannot afford private schools or to home school their children have no public school choice option such as a rigorous college preparatory seat-based charter school in the city of Santa Clarita. It is time to eradicate this lack of appropriate public school option for the most vulnerable families because regardless of the educational setting, when all our students thrive, our community thrives. A strong viable city should be strong and viable in all facets, especially in the education of all its children.
Just as the Chair of the Los Angeles County Board of Supervisors representing the 5th District Supervisor Kathryn Barger “aims to unify and expand Los Angeles County’s efforts on behalf of youth”, it is in our collective interest as a community to ensure that all our children, the future of our community, are equipped with the tools to use to keep our Valleys growing and thriving.